Projectile Video

Was air resistance noticeable?
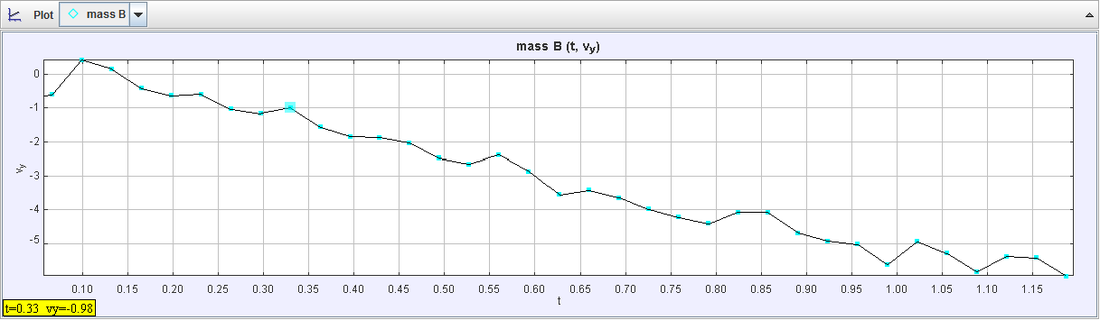
In my case, air resistance was not noticeable. Looking at the Vy vs time graph, the trend of the graph as time goes on is decreasing diagonally to the bottom right. The trend of a Vy vs time graph that has no air resistance resembles the graph produced, decreasing diagonally to the bottom right. The reasoning behind having a linear line when there is no air resistance is because there were no noticeable forces acting upon the ball on the y direction except gravity, which was at a rate of -9.8 m/s, meaning it would decrease.
Was energy conserved?
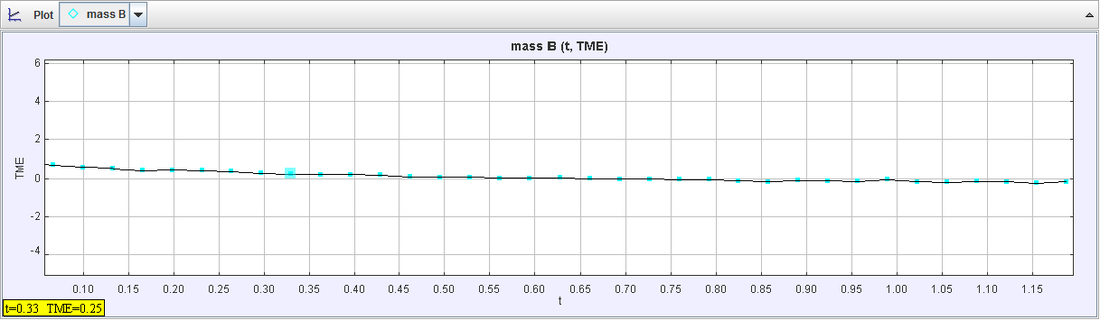
In my case, energy was not conserved. The total mechanical energy graph shows a constant line over time, with inconsistencies due to Tracker not correctly tracking the movement of the ball. Since energy is neither created or destroyed, it is converted to other forms, which Tracker does not take into account. The constant line on the total mechanical energy graph means that energy was being conserved. This conversion to other forms of energy also shows that work was being done, yet energy was being conserved.
Was momentum conserved?
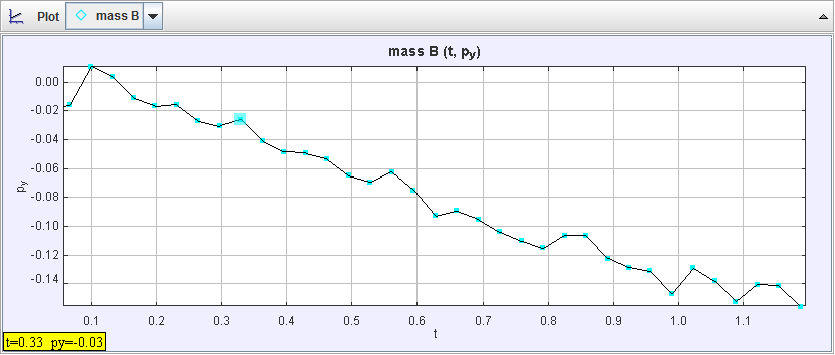
In my case, momentum was not conserved in the y direction. In my momentum in the y direction vs time graph, the graph shows a trend that is decreasing diagonally to the bottom right. The graph resembles the Vy vs time graph, and this is because of the equation py=mvy, where the mass is constant, meaning that the momentum graph should resemble the velocity graph. Since impulse is the change in momentum, the impulse of the object is coming only from gravity, meaning that momentum was not conserved.
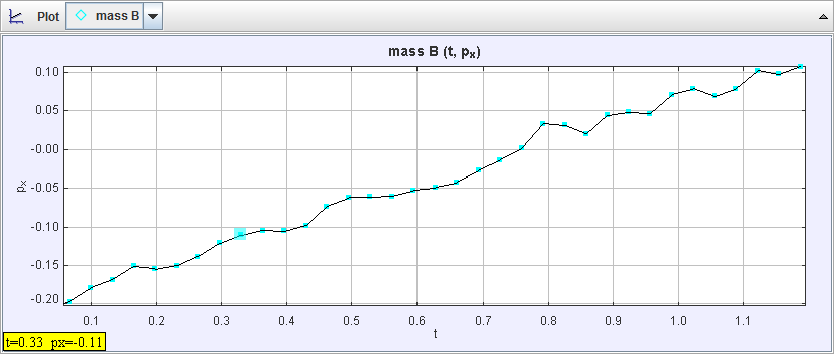
In the x direction, momentum is constantly increasing over time. This shows that the graph resembles what the Vx vs time graph would like like, due to the equation px=mvy, where the mass is constant, meaning the momentum graph would resemble the velocity graph, which means that my velocity on the x direction was increasing. The source of the impulse is likely from my hand.