Kinematics:
Position vs Time Graph
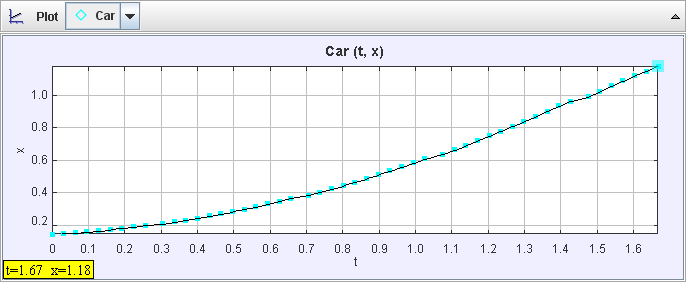
The position over time graph is curved, showing that over time, the car accelerated while going down the ramp.
Velocity vs Time Graph
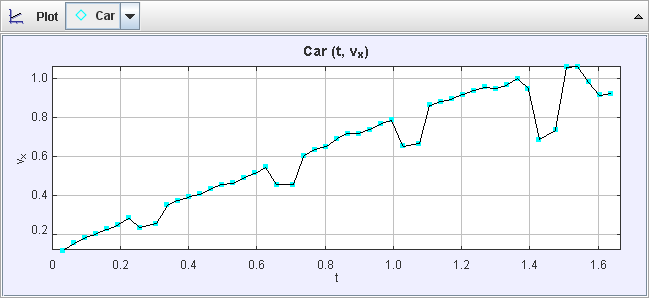
This graph is linear upwards, showing as time increases, velocity increases due to the cart going down the ramp.
Equations
(Source for all equations: https://sites.google.com/site/shardulsphysicswebsite/home/1st-nine-weeks/kart-rolling-down-ramp)
Equation 1: Vf = Vi + at
Rearranged equation: a= Vf-Vi/t
With plugged in numbers: a=0.92-0.123/1.667
If we rearrange the variables, this equation can tell us the acceleration of the cart. Using the equation, we find the acceleration to be 0.48, rounded to the nearest tenth.
Equation 2: Xf=Xi+Vit+(1/2)at2
With plugged in numbers: Xf=0.145+0.123*1.667+1/2*0.48*1.667
The equation tells us the final position of the cart, which is 0.75.
Equation 3: Vf2 = Vi2 + 2aΔx
With plugged in numbers: Vf2=0.123^2+2*0.48
The value given can tell us the final velocity of the cart, which is 0.92^2, or 0.8464.
Forces:
The force that was applied is equal to gravity pulled the cart down the ramp and since inertia is keeping it going. And because there isn't a lot of friction, because the cart doesn't weight much its easier for the cart to increase speed. Since force equals the mass of the object times its acceleration, we can use this to find the total net force of the car going down the ramp.
Equation: F=ma
With plugged in numbers: F= 0.5803 * 0.48
The equation tells us the total net force of the cart, which is 174.09 N, or newtons.
Free Body Diagram:

Energy:
When the cart is still in Mr. Physics teachers (classified person) hands, it has potential energy that is equal to .71 as it goes down the ramp it decreases and its final potential energy equals .12. When he lets go of the cart the potential energy then transforms into kinetic energy. Because the velocity increases as the cart is going down the ramp, the kinetic energy equals .53 at the end of the ramp.
1st PE= (.5803)(9.8)(.125)
2nd PE=(.5803)(9.8)(.02)
KE=1/2(.5803)(1.02)
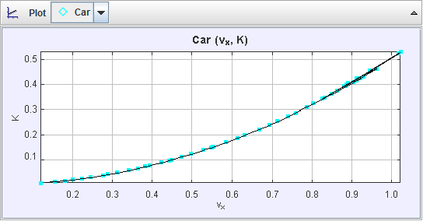
Kinetic Energy Graph:
1st PE= (.5803)(9.8)(.125)
2nd PE=(.5803)(9.8)(.02)
KE=1/2(.5803)(1.02)
Kinetic Energy Graph: